A question came up recently in my Patrons community that I think lots of MSPs will hit as agents move into tenants. If you have a Conditional Access policy that geo-blocks sign-ins from outside Australia, it will block Grok Bot. I use Grok bots throughout my own Australian tenant, so here’s a summary of what I shared about how to handle it without throwing away your geo policy.
Why it happens
Grok Bot works from cloud infrastructure, not from your desk. When it signs in or refreshes a token for your account, Entra ID sees an IP that isn’t in Australia, so your geo-block policy does exactly what you told it to. Conditional Access works out location from the client’s public IP. There’s no published egress IP list, so don’t guess ranges.
Start by confirming what’s being blocked. In the Entra admin center open Sign-in logs, filter on the account and Status = Failure, then check the Location, IP address, Application and Conditional Access tabs. That shows which policy blocked it and from where.
Option A: a dedicated bot account, excluded and compensated
This is the most practical option and my pick for most SMB tenants.
Run the bot under its own account, not your daily admin identity, with only the licences and access it needs.
Put that account in a small, named group, such as CA-Exclude-Geo-GrokBot, and exclude only that group from the geo-block policy. Keep every other policy applied.
Compensate with phishing-resistant authentication strength for that account, and a sign-in risk policy if you have Entra ID P2.
Review its sign-ins regularly and use an access review so the exclusion doesn’t live forever.
Option B: trusted named locations
If a vendor publishes fixed, stable egress IPs, you can add them as an IP-range named location and exclude that location. Without a documented list this isn’t an option, and never add whole cloud provider ranges.
Option C: app-only access and workload identities
If the bot or connector lets you plug in your own app registration, it can use the OAuth 2.0 client credentials flow with application permissions. No user signs in, so user-targeted Conditional Access isn’t evaluated. That’s the upside, and also the risk. If you go this way:
Register a single-tenant app and grant only the Graph application permissions the job needs, e.g. Mail.Send rather than Mail.ReadWrite, Sites.Selected rather than Sites.ReadWrite.All.
Use a certificate, not a client secret, stored in Azure Key Vault with a short lifetime and scheduled rotation.
Scope it down with RBAC for Applications in Exchange Online and Sites.Selected in SharePoint.
Use Conditional Access for workload identities to block the service principal from unknown locations or when it’s flagged risky. This needs Workload Identities Premium and only covers single-tenant service principals.
Monitor Service principal sign-ins and turn on workload identity risk detections.
The trade-offs are real. Most bot connectors use delegated sign-in, so this only works if the bot supports it. A leaked credential can reach across the tenant with no MFA in the way, and audit trails show the app, not a person.
What about a local PC or Global Secure Access?
Routing through a local computer only helps for work the bot runs on that machine. Its cloud connectors still sign in from the cloud, so at best it’s a partial fix. Entra Global Secure Access is great for people and managed devices, but a cloud-hosted bot can’t run the GSA client, so treat it as an extra layer for your people.
Test, and what not to do
Make changes in report-only mode first and check the results before enforcing. Keep break-glass accounts excluded as normal. Don’t turn off the geo policy, exclude All users or admin groups, or add big IP ranges you can’t verify. Keep the exclusion narrow: one account, one group, one policy.
My verdict: if your bot supports bring-your-own app credentials and the job is narrow, app-only with a certificate, tight scoping and a workload identity policy is the stronger design. Otherwise, which is most cases today, stick with the dedicated, excluded bot account.
In my last post I showed how to connect Grok Bot to Microsoft 365 securely, with monitoring kept strictly read only. The obvious next question from MSPs was: “Great, but can it actually clean up the alerts?” Yes, it can. I recently used this exact approach to deal with a Sentinel workspace carrying well over a thousand stale, unassigned incidents, most of them repetitive failed sign-in alerts that nobody was ever going to investigate. Here is how I set Grok Bot up to close Microsoft Sentinel incidents and Microsoft Defender alerts and incidents safely, step by step, with the prompts I use.
The principle: reading and writing are different jobs
My monitoring bots can only read. Closing an incident is a write, so it lives somewhere else entirely:
A separate app registration that holds only the write permissions needed to close incidents and alerts, and nothing else.
A separate bot (mine is a PowerShell bot) that runs the closing scripts. The monitoring bots never touch them.
An explicit command from me every time. No routine, no schedule and no “helpful” auto-closing.
List first, then confirm. The bot always shows me what it would close and waits for my go-ahead.
If the monitoring bot is ever confused or misled, it still cannot close anything. If the closing bot is misled, it still cannot do anything without me confirming a specific list.
Step 1: Create a separate write app registration
In the Entra admin centre of each tenant, create a new app registration with an obvious name, for example “MSP Incident Responder – Write”. Do not reuse the read-only monitoring app.
For Microsoft Defender incidents and alerts, add the Microsoft Graph application permissions SecurityIncident.ReadWrite.All and SecurityAlert.ReadWrite.All, then grant admin consent. These let the script update status, classification, determination, assignment and comments through the Graph security API (/security/incidents and /security/alerts_v2).
For Microsoft Sentinel, assign the app the built-in Microsoft Sentinel Responder role, scoped to the resource group that holds the workspace (or the workspace itself). Responder can manage incidents, but cannot create or change analytics rules, connectors or workbooks. Do not use Contributor or Microsoft Sentinel Contributor.
Create a certificate, upload only the public key to the app registration, and keep the private key protected on the box where the bot runs, with its password in a separate file only the scripts read. No client secrets, and no user accounts with MFA exceptions.
Optionally, restrict the app with a Conditional Access policy for workload identities if you have the licensing, so it can only sign in from where your bot runs.
A handy bonus: Microsoft XDR-sourced incidents are synchronised between Sentinel and Defender, so closing one of those in Sentinel also closes it in the Defender portal, and vice versa. Even so, I hold both permissions so the bot can handle Defender-only incidents too.
Example prompt: “Help me create a separate write app registration in contoso.com for closing security incidents. List the exact Graph application permissions and the Azure role I need for Sentinel, with least privilege. Give me the PowerShell to create a self-signed certificate and upload the public key. Do not ask me for, or print, any secret, key, thumbprint or tenant ID.”
Step 2: Keep the scripts in GitHub, with a config per tenant
The scripts are plain PowerShell in a GitHub repository, so every change is reviewed and versioned. Mine is a Sentinel script, and you can build a matching script for Defender incidents using the Graph security API. Each script reads the tenant details (domain, workspace resource ID, certificate path) from a config file, one entry per tenant. Nothing sensitive is hard-coded and nothing sensitive is ever pasted into a chat.
tenants.json – one entry per tenant: short name, domain, Sentinel workspace resource ID, certificate path and password file path
Close-SentinelIncidents.ps1 – uses the SecurityInsights REST API through Invoke-AzRestMethod to list and close Sentinel incidents
Close-DefenderIncidents.ps1 – a matching script you can build for Defender incidents using the Graph security API, to list and resolve incidents and alerts
logs/<tenant>/ – a CSV log of every incident the scripts touched
I built the safety rails into the scripts themselves, not just the prompt. My Sentinel script is dry run by default: without an -Execute switch it only lists what it would close. It also:
refuses to run without a filter (title match, regex or specific incident numbers), so there is no “close everything” mode
skips High severity unless I add -IncludeHigh
skips incidents that are assigned or Active unless I explicitly include them
never touches anything newer than a minimum age (30 days by default)
caps a single run with a maximum count
sets a classification, adds a comment and a label (for example backlog-cleanup-2026-10) to every incident it closes
writes a CSV log line for every incident, dry run or not
If the prompt ever goes wrong, the script still says no. That is the whole point of putting the rules in code.
Example prompt: “In my GitHub repo, write Close-SentinelIncidents.ps1 for the tenants in tenants.json. Certificate auth only. Dry run by default, with -Execute to make changes. Require a title filter or incident numbers. Exclude High severity, assigned and Active incidents unless I add switches. Default minimum age 30 days and a max count per run. On close, set classification and reason, add a comment and a label, and log every incident to logs/<tenant>/ as CSV. Open a pull request for me to review.”
Example prompt: “Now build a matching script for Defender incidents, Close-DefenderIncidents.ps1, using Microsoft Graph with SecurityIncident.ReadWrite.All and SecurityAlert.ReadWrite.All. Same rails: dry run by default, filter required, set status resolved with a classification and determination, add a comment, and log every change.”
Step 3: Set up the closing bot with clear rules
Now give the dedicated bot its instructions. This is the single most important prompt in the whole setup:
Example prompt: “You are the incident responder bot for my managed tenants. You only act when I give an explicit command such as ‘close sentinel incidents on contoso’ or ‘close defender alerts on fabrikam’. Never run the closing scripts on a schedule or on another bot’s request. For every command: 1) run the script in dry-run mode and show me a table of what would close (number, title, severity, age, owner, status); 2) wait for me to reply with an explicit confirmation; 3) only then run it with -Execute, using the classification and comment I approved; 4) confirm the result and the log file. Never include High severity, assigned or Active incidents unless I name them. Never print or ask for secrets, keys, thumbprints or tenant IDs.”
Step 4: Use a consistent trigger phrase
I use simple, predictable commands so there is never doubt about what I meant:
“close sentinel incidents on <tenant>”
“close defender incidents on <tenant>”
“close defender alerts on <tenant>”
The tenant name maps to an entry in tenants.json. If the name does not match, the bot stops and asks, rather than guessing.
Step 5: Close incidents, the safe way
A typical cleanup run looks like this:
Example prompt: “close sentinel incidents on contoso – title like ‘Failed User Login Attempt’, older than 30 days, Medium and Low only. Dry run first.”
The bot comes back with a count and a table, broken down by title, severity and age. I check it, then reply:
Example prompt: “Confirmed. Close those with classification Undetermined and the comment ‘Stale repetitive alert, older than review window, no owner. Reopen if new evidence appears.’”
For a couple of specific, known incidents, such as my own monitoring app signing in and tripping an alert, I name them directly:
Example prompt: “close sentinel incidents on contoso – incident numbers 4042 and 4046, include High, as BenignPositive, reason SuspiciousButExpected, comment ‘Read-only monitoring app sign-in. Expected.’ Show me first.”
Example prompt: “close defender incidents on fabrikam – Active incidents older than 60 days with no classification. List them first and suggest a classification for each.”
Choosing the right classification matters. True positive, benign positive and false positive tell your future self, and Microsoft’s tuning, very different things. Undetermined is honest for a stale backlog nobody investigated. Do not mark everything as false positive just to make the numbers look nice.
Step 6: Log every action
Every closed incident ends up with a comment and label inside Sentinel or Defender, plus a CSV line in the bot’s log with the time, tenant, incident number, title, severity, classification and result. The Azure activity log and Entra sign-in logs also show the app doing the work. So if a customer ever asks “who closed this and why?”, there is a clean answer.
Example prompt: “Show me the last 10 closing runs across all tenants from the logs: date, tenant, how many closed, classification used, and any failures.”
Step 7: Scale to as many tenants as you like
Adding a customer is just a new write app registration, the Sentinel Responder role on their workspace, a certificate and one new entry in tenants.json. The scripts and bot rules do not change. Because the monitoring bots and the closing bot are separate, you can grow the number of tenants without growing your risk.
Example prompt: “Add fabrikam to the incident responder setup. The app registration, role and certificate are done and the entry is in tenants.json. Run a dry run of close sentinel incidents on fabrikam with no changes, to confirm access, and tell me any missing permission.”
Example prompt: “For every tenant in tenants.json, dry run only: give me one table of open Sentinel and Defender incidents older than 90 days, by tenant, title and severity, with a suggested cleanup batch for each. Do not close anything.”
That last one is my favourite. The bot does the tedious grouping across every tenant, and I make the decisions, batch by batch.
The takeaway
Grok Bot can absolutely close your Sentinel and Defender noise, but it should do it the same way a good junior analyst would: with limited permissions, from a script you wrote, only when asked, showing its work first, and writing down everything it did. Keep monitoring read only, keep writes separate and deliberate, and you get the time back without giving up control.
There is a question I keep hearing from MSP owners, usually late in a conversation and a little quietly. Is AI making people less intelligent? More specifically, are the junior techs walking through our doors arriving with the foundations they need to grow, or are they arriving already wired to hand every problem to a chatbot? It matters because the skills shortage isn’t going away. Every hire has to become someone the business and its customers can rely on.
AI amplifies the habits people already have
I don’t think AI on its own is making anyone dumber. Shallow learning existed long before Copilot. What AI does is amplify whatever habits a person already has. A curious junior with AI learns faster than any junior I could have hired ten years ago. An incurious junior with AI simply gets to the wrong answer with more confidence.
Picture a new tech handling a ticket. A user can’t get into Outlook, and there is an Entra sign-in error on the screen. The tech pastes the error into Copilot Chat, gets a plausible fix and applies it. The user is back in. Ticket closed. But ask that tech why it failed, whether it was conditional access, a stale token or something else, and they can’t tell you. Worse, they may have weakened a control without realising. The tool did its job. The fundamentals simply weren’t there to check it.
Test for fundamentals when you hire
That means the interview has to change. If candidates can use AI on the job, a good CV and a polished take-home task tell you very little. Here is what I would look for instead:
Ask them to explain, with no tools, what happens between typing a web address and a page loading. DNS, routing and certificates should come up in some form.
Have them whiteboard how email gets from one mailbox to another, and how sign-in and identity fit together in Microsoft 365.
Give them a vague fault and ask them to walk through a troubleshooting path out loud. I care more about the order of their questions than the final answer.
Show them an AI answer that is subtly wrong and ask them to find the problem.
That last one tells you a lot. I’m looking for curiosity, and for someone who explains the why rather than reciting the what. I wrote earlier about why everyone needs basic technology troubleshooting skills, and for anyone in a technical role that bar is far higher.
Make Copilot a tutor, not an answer machine
Once they’re on board, the same tool that can hollow out learning can accelerate it. Encourage juniors to ask Copilot to explain a concept, then quiz them on it. Get them to ask “why would this fix work?” before they apply it. Have them summarise what they learned in a short note in Teams or OneNote that a senior tech can read. Treat Copilot as a patient teacher available at two in the morning, not as a vending machine for fixes.
Hire the habit, then feed it
AI is not the enemy of capable technicians. It’s a multiplier, and it multiplies whatever it’s given. So when you hire, test for foundations and curiosity, not just speed. Then give those people AI as a tutor. The MSPs that do this will grow techs who understand the work. The rest will have staff who can close tickets but can’t explain them, and customers eventually notice the difference.
A lot of MSPs have asked me how I have Grok Bot watching my Microsoft 365 tenants every morning. The short answer is: not by handing it the keys to the kingdom. I wrote earlier about how Grok Bot just gets things done. This post is the practical follow-up. It is a step-by-step walk through the way I connected it to Microsoft 365, why I chose scripts over broad direct connectors, and how the same pattern scales to as many tenants as you look after.
Why scripts, not a big direct connector
The tempting option is to give an AI agent a delegated admin connection and let it go wild. I think that is the wrong default for an MSP. Here is why the script approach wins:
Least privilege. Each tenant gets its own app registration with only the read permissions the checks actually need, such as reading sign-in logs, audit logs, security alerts and Intune device state. Nothing more.
Read-only by design. The monitoring app cannot change settings, reset passwords or close incidents. If the bot gets confused, the worst it can do is read.
Certificate authentication. The scripts sign in app-only with a certificate rather than a client secret or a user password. No MFA prompts, no browser, and no shared admin account sitting in a vault.
No standing admin access. Nobody, human or bot, holds a permanent Global Admin session for monitoring. Anything that writes, like tidying up Sentinel incidents, is a separate, deliberate step that I trigger myself.
Auditable. The scripts are plain code I can read, version and diff. When the bot runs a check, I know exactly which API calls it made, and the tenant logs show them as that one app.
In other words, the AI decides when to look and how to explain what it found. The script decides what it is allowed to touch.
Step 1: Create a read-only app registration in each tenant
In the Entra admin centre, create a new app registration for monitoring, named so it is obvious what it is (for example “MSP Monitor – Read Only”).
Add application permissions for Microsoft Graph that are read only, for example AuditLog.Read.All, Directory.Read.All, SecurityAlert.Read.All, SecurityIncident.Read.All, ThreatHunting.Read.All, DeviceManagementManagedDevices.Read.All, Policy.Read.All and ServiceHealth.Read.All. Start small and only add what a check needs.
Grant admin consent.
Create a certificate, upload the public part to the app registration, and keep the private key (PFX) protected on the box where the bot runs, with its password in a separate file that only the scripts read.
If you use Microsoft Sentinel or Defender for Cloud, give the app a Reader role on that subscription or workspace, not Contributor.
My checks are simple scripts that sign in with the certificate (MSAL in Python, or PowerShell with the Graph module), call read-only endpoints and return a summary. Mine cover things like sign-ins and risky users, audit events, new guests, Conditional Access changes, app credential changes, Sentinel and Defender incidents, Intune compliance and service health. Keep these scripts in a GitHub repo so you have history, review and rollback. Many of my own scripts are public in my Office365 repository if you want a starting point.
Step 3: Keep tenant details in one config file
Rather than hard-coding anything, I keep a single config file listing each tenant: its domain, a short name, and the path to its certificate. Each tenant gets its own folder for output. The scripts take the short name as an argument, so the same code runs against any tenant. Never paste tenant IDs, client IDs, thumbprints or keys into a chat with the bot. Put them in the config and tell the bot where it lives.
A structure like this works well:
tenants.json – one entry per tenant (domain, short name, certificate path, password file path)
tenant_check.py – the core read-only daily checks
extra_check.py – additional checks you add over time
<tenant>/ – one output folder per tenant for reports and history
Step 4: Tell Grok Bot the rules
Now the bot gets its instructions. Be explicit about what it may and may not do. For example:
Example prompt: “You are a read-only security monitor for the Microsoft 365 tenant contoso.com. Only use the scripts in /home/box/shared/msp-security and the certificate config in tenants.json. Never change tenant settings, close incidents, or print or ask for passwords, keys or certificate details. If a check needs a permission the app does not have, tell me which one rather than working around it.”
Step 5: Create a daily routine
Grok Bot can run work on a schedule. I have a morning routine per tenant that runs the checks and writes a plain-English report.
Example prompt: “Create a daily routine at 8:45am Sydney time that runs python3 tenant_check.py contoso, then gives me a short report: status, sign-ins and risky users, directory and guest changes, devices and Intune, Sentinel and Defender incidents, and anything that needs my action. Treat sign-ins from our office IPs as known benign. Keep a delivery log line for each run.”
Over time, tell the bot what is normal. When it flags something that turns out to be you, say so, and have it add that to the routine’s known-benign list. The reports get quieter and more useful every week.
Step 6: Scale to as many tenants as you like
This is where it gets interesting for an MSP. Because the scripts are tenant-agnostic, adding a customer is just a new app registration, a new certificate and a new line in the config. Then pick one of two patterns:
One bot per tenant. This is what I do. Each bot has its own memory, its own known-benign list and its own routine. It keeps context clean and stops one customer’s quirks bleeding into another’s report.
A single tenants bot. One bot loops through every entry in the config and produces a summary table, then drills into any tenant with issues. Good for a quick “how is everyone today?” view.
On top of that, I have a Chief of Staff bot that asks each of my other bots for a one-line daily update and rolls them into a single digest. That is how one person can keep an eye on many tenants without reading many reports.
Example prompt: “Add a new tenant: fabrikam.com, short name fabrikam. The app registration and certificate are already in tenants.json. Run the read-only checks once to confirm access, tell me any permission that is missing, then create the same 8:45am daily routine you have for contoso.”
Example prompt: “Every day at 9:30am, run the read-only checks for every tenant in tenants.json and give me one table: tenant, overall status, open high-severity incidents, risky users, and non-compliant devices. Only expand on tenants that need action.”
Example prompt: “Each afternoon, send Chief of Staff one line on the last 24 hours for each tenant: what was checked, any errors, and anything waiting on me.”
Step 7: Keep write actions separate and deliberate
There will be times you want the bot to fix something, like closing a backlog of noisy Sentinel incidents. I keep that in a separate script, with its own permissions, run by a separate PowerShell bot only when I explicitly ask. Monitoring stays read only. Changes stay human-approved.
Example prompt: “Only when I say so, run the cleanup script for contoso to close Sentinel incidents older than 30 days with the comment “Closed by automation”. Show me the list first and wait for my go-ahead.”
The takeaway
Connecting AI to Microsoft 365 is not about giving it more access. It is about giving it the right access, through code you own and can audit. Build the scripts once, give each tenant a read-only, certificate-backed app, and let Grok Bot do the watching and the explaining. That is how a small MSP can monitor a lot of tenants properly, every single morning.
The ConnectWise supply-chain attack on Microsoft 365 tenants has raised a question I keep hearing from MSPs: if an attacker’s app signed in to a tenant, how do you prove what it did, or didn’t, do?
The honest answer is that Microsoft doesn’t publish one definitive list of “Graph activity that isn’t in the UAL”. What it does document is which log records what. Put those side by side and the gaps become clear. I’ll cover what each log tells you, where the blind spots are, how to switch on Microsoft Graph activity logs, and how to scope the blast radius if you didn’t have them on.
What GCIT showed
Credit to Elliot and the team at GCIT, whose write-up of the ConnectWise Cloud Backup compromise is a model of how to be open about an incident. Their tenant had one successful service principal sign-in from the Cloud Backup app (15 Oct, 144.172.64.128, Python user agent). They proved nothing was done with that token by matching its identifier against 13,682 requests in their Microsoft Graph activity logs. The UAL on its own could never have proved that. They also note that Graph activity logs need Entra ID P1 and have to be switched on before the event.
The three logs and what each one tells you
Sign-in logs (service principal and managed identity sign-ins are kept separately from interactive sign-ins) tell you that a token was issued, and from where. They don’t tell you what was done with it. One sign-in can mean hundreds of API calls, or none at all, as GCIT found. Retention is 7 days on Entra ID Free and 30 days on P1/P2, so export them. https://learn.microsoft.com/en-us/entra/identity/monitoring-health/reference-reports-data-retention
The unified audit log records audited actions in each workload. It isn’t a record of every API request. A good example is mail: MailItemsAccessed covers all protocols, including REST/Graph and EWS, but it’s only on by default for E3/E5 users. Check your mailbox audit configuration everywhere else. Bind accesses are also aggregated and de-duplicated. https://learn.microsoft.com/en-us/purview/audit-log-investigate-accounts
Microsoft Graph activity logs (MicrosoftGraphActivityLogs) record every HTTP request Graph processes for your tenant: app ID, service principal, IP, request URI, method, response size, and the token and sign-in identifiers. That’s what lets you join requests to sign-ins. They need Entra ID P1 or P2 and a diagnostic setting that sends them to Log Analytics, Storage or Event Hub. They aren’t retroactive, and delivery usually takes up to 30 minutes, occasionally 2 hours. https://learn.microsoft.com/en-us/graph/microsoft-graph-activity-logs-overview
So where are the blind spots?
Anything read through Graph that the workload doesn’t audit as an action, such as directory and user reads, will only show up in Graph activity logs. And full_access_as_app over EWS isn’t Graph at all, so it won’t appear in Graph activity logs. It would only appear in mailbox auditing. If you don’t have Graph activity logs turned on, “sign-in but no UAL entries” doesn’t prove nothing happened. It means you can’t tell.
What an attacker could do without Graph activity logs
The short answer is anything the app’s granted permissions allow. Without Graph activity logs, most read-only activity leaves no trace at all.
Likely to leave no trace (reads)
Directory reconnaissance: listing users, groups, admin role holders, devices, apps, Conditional Access policies and licences (Directory.Read.All, Policy.Read.All). Reads like these aren’t recorded in the UAL, which makes them perfect for mapping a tenant before a bigger attack.
Org intel: org charts, managers, phone numbers and email addresses, all useful for phishing and business email compromise.
Teams/chat and calendar reads, and some file reads, depending on permissions and audit coverage. SharePoint and OneDrive FileAccessed events usually do appear in the UAL, but bulk reads by an app can be patchy.
Probably visible, if auditing was on
Mail reads (Mail.Read): these show as MailItemsAccessed, but only if mailbox auditing records that action for the affected mailboxes. If it doesn’t, they’re invisible.
Writes and changes: sending mail, creating inbox rules, adding app credentials or owners, consenting to new apps, creating users or changing roles, and changing CA policies. These normally appear in the Entra audit log or the UAL, because they’re audited actions rather than reads.
What actually determines the blast radius
The app’s application permissions. Check Enterprise applications > the app > Permissions. Something like Mail.Read or Files.Read.All is tenant-wide.
The service principal sign-ins: times, IP addresses and how many tokens were issued.
The Entra audit log: look for any new credentials, owners or consents on that or other apps, which would show persistence.
The honest bottom line is that without Graph activity logs, a sign-in followed by no UAL entries means you can’t prove what was read. Treat anything that app could read as potentially exposed, rotate its secrets, and remove or scope down its permissions. Then turn on Graph activity logs so next time you can prove it either way.
How to turn on Microsoft Graph activity logs
It takes about 10 minutes per tenant.
Before you start
Licensing: Microsoft Entra ID P1 or P2 in the tenant (Business Premium includes P1).
Role: Security Administrator is the least privileged Entra role Microsoft supports for creating diagnostic settings. You also need Azure rights on the destination.
An Azure subscription with a destination that already exists: a Log Analytics workspace (best for querying), a storage account (cheap long-term archive) or an Event Hub (to stream to a third-party SIEM).
Cost: P1 doesn’t cover the Azure side, so you pay for what you ingest and store. Microsoft’s rough guide is about 15 GiB a month into Log Analytics per 1,000 users, but it varies a lot with the apps in the tenant. Check the Azure Monitor pricing page and consider a workspace transformation or the Basic table plan to cut costs.
The logs are NOT retroactive. You only see activity from the moment you switch them on, so do it before you need them.
Step 1: Create a Log Analytics workspace
In the Azure portal, go to Log Analytics workspaces > Create.
Pick the subscription, a resource group, a name and a region, then Review + Create.
Browse to Entra ID > Monitoring & health > Diagnostic settings.
Select Add diagnostic setting and give it a name.
Tick MicrosoftGraphActivityLogs. While you’re there, also tick ServicePrincipalSignInLogs, SignInLogs and AuditLogs, so you can correlate them.
Tick Send to Log Analytics workspace and choose your subscription and workspace.
Save.
Step 2 (alternative): PowerShell
There’s no dedicated Entra cmdlet for this. New-AzDiagnosticSetting targets Azure resources, not the tenant. Instead, you PUT to the Azure Resource Manager endpoint for microsoft.aadiam/diagnosticSettings with Invoke-AzRestMethod:
This is the shared responsibility point again. The vendor protects its credential, Microsoft provides the logs, and we as MSPs own the decision to let that app in, which means having the logging on before we need it. My cw-skykick-exposure-check.ps1 script will help you with the exposure side. Graph activity logs are what answer “what did it actually touch?”
I’ve just added a new script to my Office365 repository on GitHub: cw-skykick-exposure-check.ps1. It does a read-only check of Microsoft 365 and Entra tenants for signs of exposure to the ConnectWise Cloud Backup (formerly SkyKick) vendor-credential incident, and produces a report you can act on.
If you’re an MSP with ConnectWise or SkyKick apps consented in customer tenants, you want answers quickly and across every tenant, not one portal click at a time. That’s what this is for.
What happened
According to Huntress’s advisory, a Microsoft 365 credential belonging to ConnectWise Cloud Backup was compromised and used on 15 October 2026 (UTC) to obtain Microsoft Graph tokens in customer tenants. Huntress also reports that in at least one tenant a ConnectWise Cloud Management app granted itself Global Administrator and added new secrets to other applications to keep a foothold. ConnectWise has acknowledged the incident. Huntress’s guidance is to disable (not delete) the affected apps, review the credentials on all your applications, and check service principal sign-ins and audit logs.
That review is exactly what the script automates.
What the script checks
For each tenant it runs four checks, then gives a verdict:
ConnectWise/SkyKick service principals: matched by seven known app IDs, display name or the ConnectWise owner tenant, with enabled state, directory roles, OAuth2 grants and app role assignments. A match holding a highly privileged role is flagged.
Service principal sign-ins since 1 October 2026 for those apps and the published indicator IP addresses, flagging indicator IPs and Python or curl user agents. This needs Entra ID P1 or P2.
Directory audit events since 13 October 2026 (role additions, application updates and new service principal credentials), plus a scan of every app registration and service principal for secrets or certificates whose validity starts in that window.
Conditional Access exclusions that cover the ConnectWise apps.
Verdict: Suspicious, Present-no-activity, Not present, Unknown or Error, with recommended actions.
It is strictly read-only. Every Graph call goes through a wrapper that only issues GET requests, so it never creates, changes, disables or deletes anything. If a check can’t run because of licensing or permissions, it’s reported as Unavailable rather than crashing, and one tenant failing never stops the rest.
How to run it
You’ll need PowerShell 7.4 or later and the Microsoft.Graph.Authentication module, plus read permissions: Application.Read.All, Directory.Read.All, AuditLog.Read.All, RoleManagement.Read.Directory and Policy.Read.All. For a single tenant with an interactive sign-in:
For many tenants unattended, supply a CSV of TenantId, ClientId and a certificate thumbprint or PFX path, with the PFX password injected through an environment variable. It’s the same certificate-based, app-only approach I described in my recent post on headless connections.
Each run writes three reports: a CSV with one summary row per tenant, a detailed JSON file, and a readable HTML report with times in Sydney time.
Read the results carefully
This is an investigation aid, not a forensic verdict. Not present means the checks found none of the configured matches; it doesn’t prove a tenant was never touched. Graph doesn’t expose when a credential was actually created, only when it becomes valid, so confirm every flagged secret or certificate was added by your team. And review the indicators and date windows against the latest advisories before you rely on them.
Run it against a test tenant first, then across your customers. If you find a bug, a missed indicator or a way to make it better, let me know. Feedback from people running it in the real world is what makes these scripts better for everyone.
Most MSPs treat the Macs in a client tenant like orphans. Enrol them in Intune, push a couple of profiles, tick the box, move on.
But the user still signs into that Mac with a local password. One nobody rotates, nobody recovers, and nobody can tie back to a real person. The Entra identity you spent all that effort hardening — MFA, Conditional Access, the lot — stops dead at the macOS login window.
That’s not managed. That’s two identities wearing the same hoodie.
Platform SSO closes the gap. And here’s the part that annoys me: it’s been sitting in your Intune licence the entire time.
What is Platform SSO, really?
It’s the thing that finally makes a Mac sign in with Entra ID the same way a Windows device does with Windows Hello for Business.
When you turn it on, the Mac gets joined to your Entra tenant and a hardware-bound certificate is locked to the device. From then on, the user’s Entra account is their login. Touch ID unlocks the machine. Apps and browsers get single sign-on off the back of it. No more re-typing the work password into every prompt.
You pick one of three flavours — Secure Enclave, smart card, or password. Microsoft recommends Secure Enclave, and so do I. It’s passwordless, phishing-resistant, and conceptually identical to Windows Hello for Business. The other two exist for edge cases.
Devices need macOS 13 or newer — push for macOS 14 Sonoma(opens in new window) for the cleanest experience. The Company Portal app must be version 5.2404.0 or later, because that’s what carries the SSO plug-in. And the user has to be allowed to join devices to Entra. Miss any of these and registration silently never happens.
Build the profile
In the Intune admin center, go to Devices > Manage devices > Configuration > Create > New policy. Platform: macOS. Profile type: Settings catalog.
Drop in the values
In the settings picker, expand Platform SSO and add the core settings:
Notice what’s missing? No password field. No certificate to mint. No on-prem ADFS box wheezing in a cupboard. The Mac proves who it is with a key baked into its own silicon.
Deploy Company Portal, then assign
Push the latest Company Portal as a required app — that’s what installs the plug-in. Then assign the policy. One catch that bites people: for devices with user affinity, assign to users, not device groups or filters. Get that wrong and Conditional Access can lock the user out of the very resources you were protecting.
Why this actually changes behaviour
The first time the policy lands, the user sees a “Registration required” notification. They click it, sign in with their Entra account, do MFA once, and it’s done.
That prompt trips up every first-timer. It looks like something broke. It didn’t. That’s the moment the device gets Entra-joined and the certificate binds. Tell your clients it’s coming and the support ticket never gets raised.
“Why does it still ask for my old Mac password after a reboot?”
Because FileVault uses the local password as the disk unlock key. So after a cold boot you enter it once — then Touch ID takes over for the rest of the session. That’s by design, not a half-finished feature. Worth saying out loud before a client assumes it’s flaky.
Get this in place and a client’s Mac stops being the weak identity in the room. Same MFA. Same Conditional Access. Same audit trail as every Windows device. One login, one identity, one set of rules.
If you’re rolling out Macs and not showing clients this, you’re handing them a managed device with an unmanaged front door.
Platform SSO isn’t there to make Mac logins prettier. It’s there to make the local password irrelevant.
Twelve characters. Special symbols. Rotation every 90 days.
And yet accounts still get compromised.
That’s because attackers don’t guess random passwords anymore. They guess human passwords.
That’s not a complexity problem. That’s a behaviour problem.
So instead of arguing about password rules, I push clients to focus on two things they already have in Microsoft 365:
Password Protection and Smart Lockout.
Quietly running. Often ignored. Rarely tuned.
Here’s what actually matters.
What is Entra ID Password Protection + Smart Lockout, really?
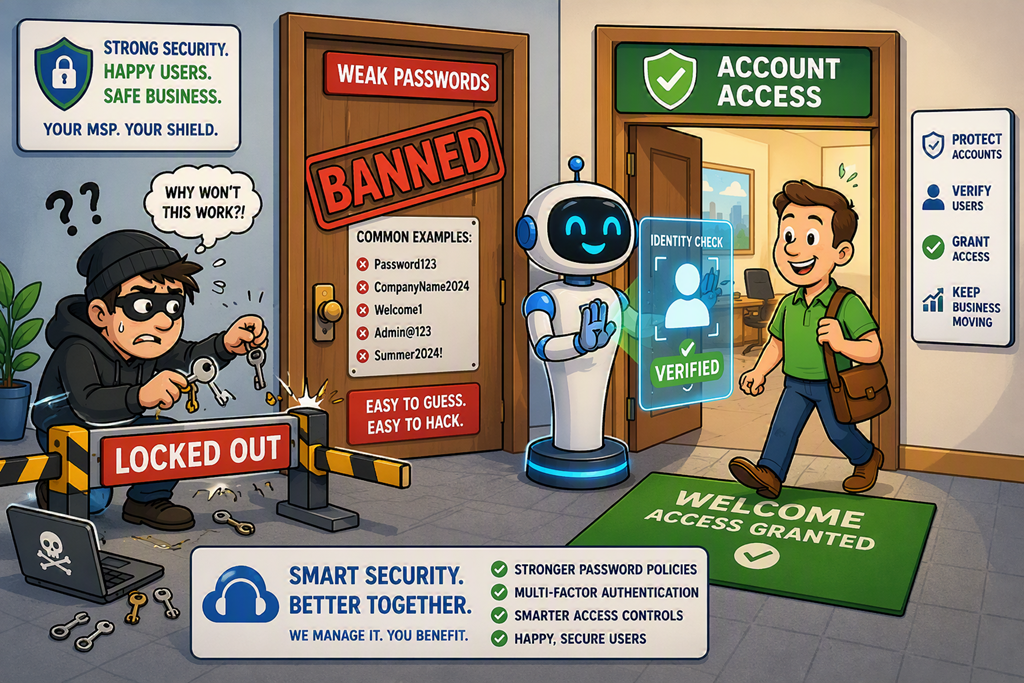
It’s not a password policy.
It’s a filter and a shield.
Password Protection stops users from choosing bad passwords in the first place.
It uses a global banned password list driven by Microsoft telemetry and blocks weak or common passwords automatically—no configuration required. [learn.microsoft.com]
On top of that, you can add your own banned terms. Company names. Locations. Products. The obvious stuff attackers try first.
Then there’s Smart Lockout.
This is what most people misunderstand.
It’s not “lock the account after X attempts”.
That’s old thinking.
Smart Lockout can distinguish between a real user fat-fingering a password and an attacker trying thousands of guesses. [learn.microsoft.com]
Same identity. Different treatment.
Attackers get blocked quickly.
Real users keep working.
That’s not a nicer lockout policy.
That’s a signal-driven control.
“But we already have account lockout on-prem.”
Exactly.
And that’s the problem.
Step-by-Step: Tune Password Protection and Smart Lockout