I recently did a presentation for the Brisbane Azure User Group on Azure Sentinel, which you can find above or here:
https://www.slideshare.net/directorcia/introduction-to-azure-sentinel-246191172

Information about SharePoint, Microsoft 365, Azure, Mobility and Productivity from the Computer Information Agency
I recently did a presentation for the Brisbane Azure User Group on Azure Sentinel, which you can find above or here:
https://www.slideshare.net/directorcia/introduction-to-azure-sentinel-246191172
One of the perennial high powered technology debates is whether Light or Dark mode is better. This ranks alongside similar torch and pitch fork ‘discussion’ events like iOS or Android, PC or Mac and tabs or spaces. Luckily, just about everything these days, including Microsoft 365, supports a choice of modes.
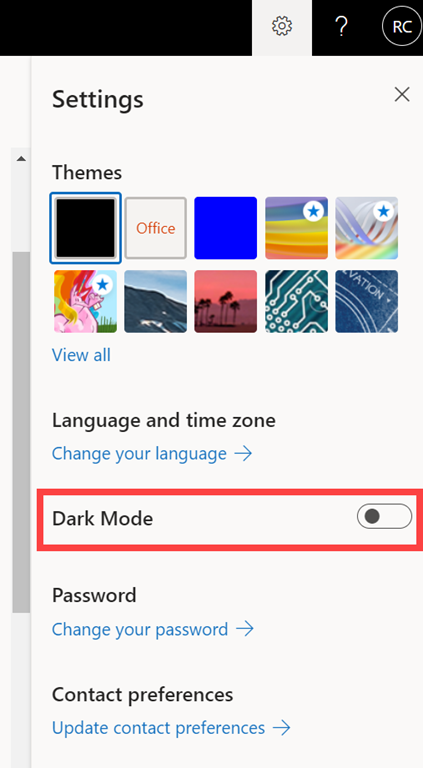
Now I’ve dabbled with switching to dark mode over the years but recently I’ve decided to go all in for at least 30 days. This means I’ve switched EVERYTHING to dark mode. Every app, every device. Dark mode everywhere.
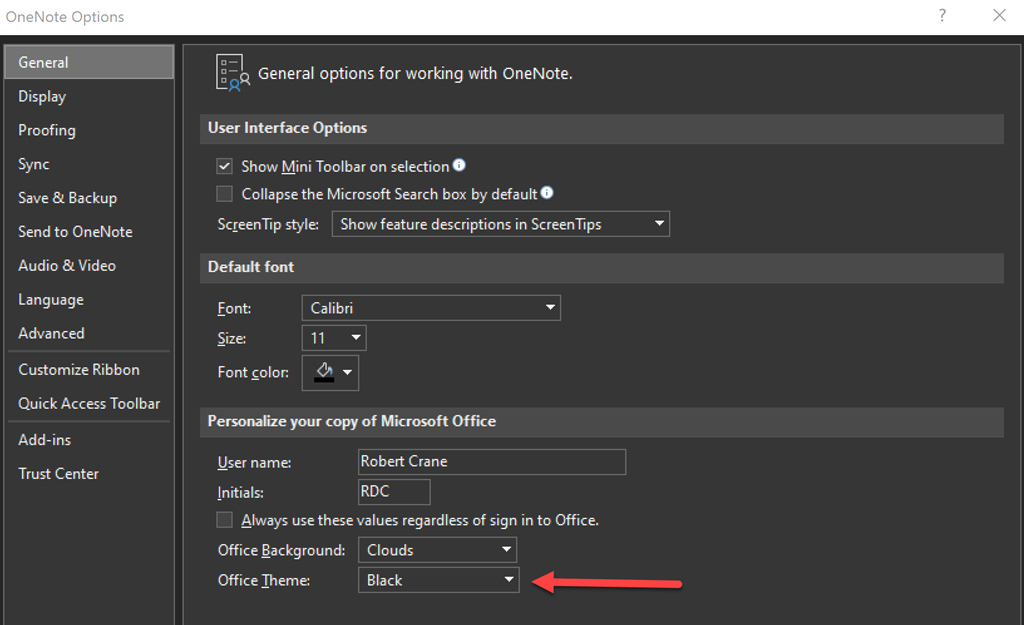
So, I’ve switched my Office apps (OneNote above), browsers (Edge and Brave) as well as Microsoft 365 and Azure into dark mode.
A few days in, I gotta admit, that it takes some getting used to. The border of desktop windows is much harder to find along with the dialog windows header. I notice far more reflection from what’s behind me when using my Surface PC, which is somewhat distracting, and the local post office had issues scanning an email QR code on my iPad until I changed it back to light mode. However, I’m sticking it out for the full 30 days to see but I’m not a convert as yet by any means.
I think that dark mode works a lot better if you are a coding type who spends hours and hours every day looking at lines of code. That is not the case for productivity workers who are regularly swapping between applications. This, in my opinion, is much harder when using dark mode.
Let’s see what the 30 day trial brings. I do appreciate the benefits but whether these are noticeable to me, only time will tell.
Yes Virginia, it is now possible to use PowerShell with Azure Sentinel. Microsoft has made available the Az.Security insights module that allows you to work with Azure Sentinel. You’ll find the module here:
https://www.powershellgallery.com/packages/Az.SecurityInsights/0.1.0
and you install it in your elevated PowerShell environment via the command:
Install-Module -Name Az.SecurityInsights –AllowClobber
To use the module commands you’ll also need to login to Azure. You can do that by using my connection scripts which are here:
An easier way to connect using PowerShell
However, what I’ve done to make it even easier for you by creating a complete script here:
https://github.com/directorcia/Office365/blob/master/az-sentinel-ruleget.ps1
You run the script in your environment like so:

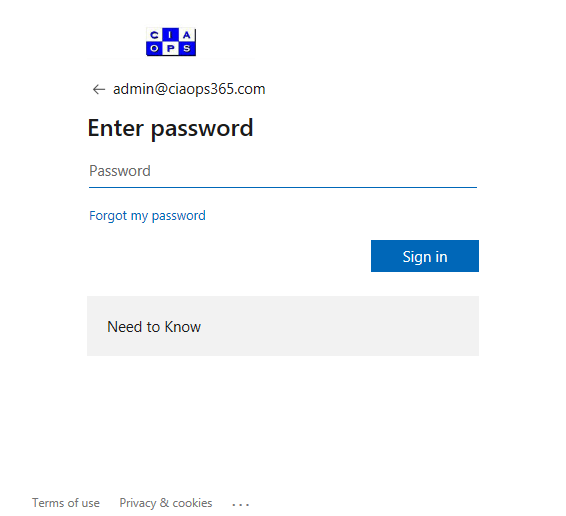
You’ll then be prompted to login to your Azure tenant like so:
You’ll then be prompted to select your Azure subscription where Sentinel is configured:
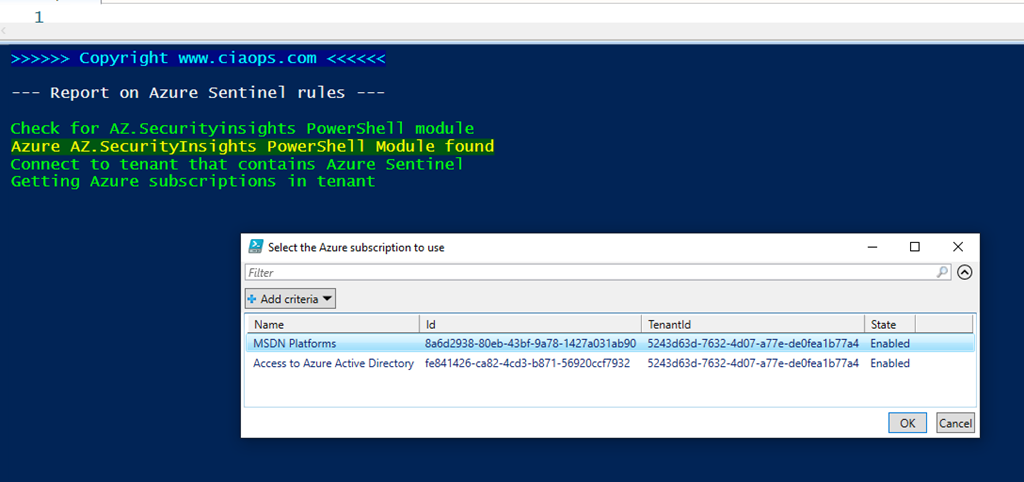
You should see a list of all the subscriptions in your tenant as shown above. Select the one where Azure Sentinel is configured and select OK to continue.
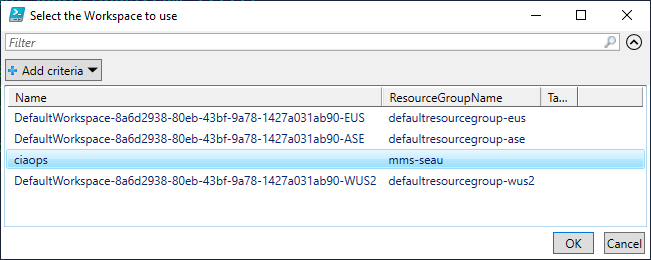
You’ll then be prompted to select which workspace Azure Sentinel is configured with. Again, just select the appropriate workspace and then OK to continue.
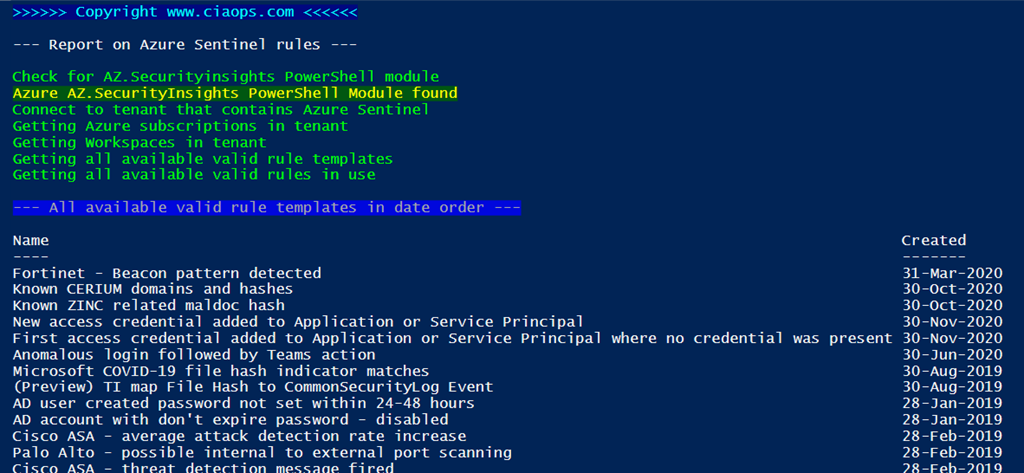
The script will now display a list of all the available Rule Templates in Sentinel as shown above, sorted by most recently added (handy to see what’s new!).
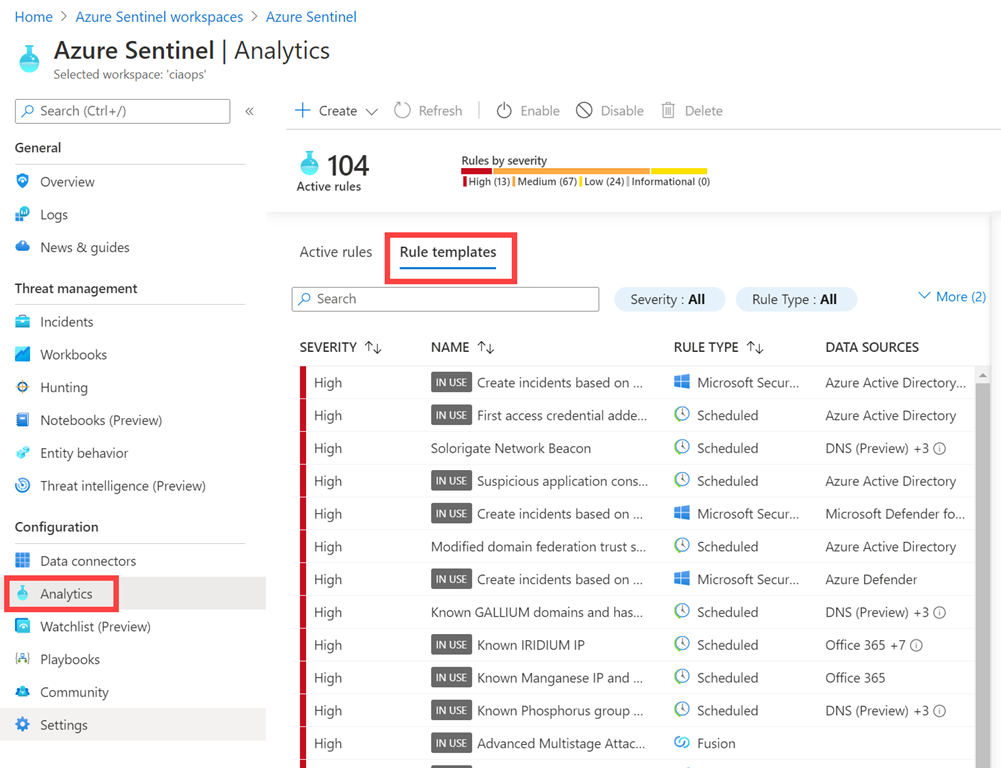
This list is what you see in the Azure Sentinel portal when you select Analytics, then Rule templates as shown above. In effect, this is every analytics rule Sentinel makes available to you.
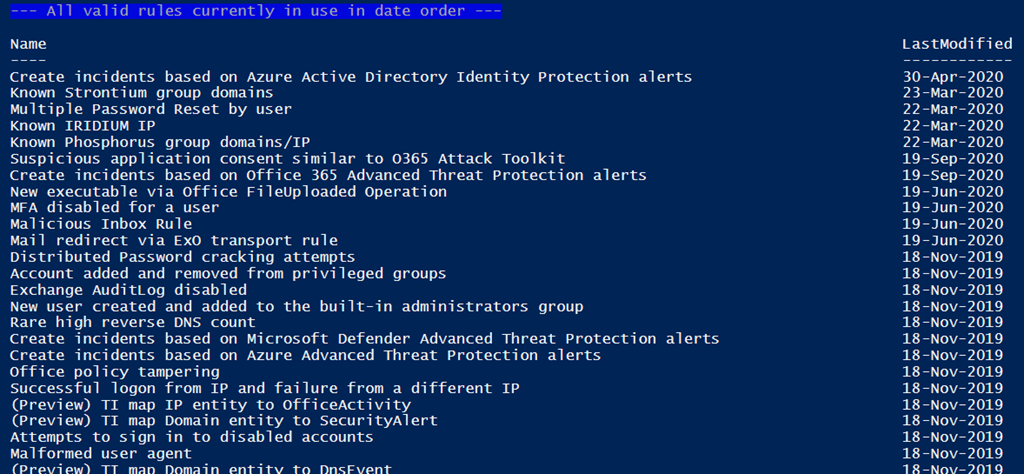
The next part of the script output will show you every rule in use.
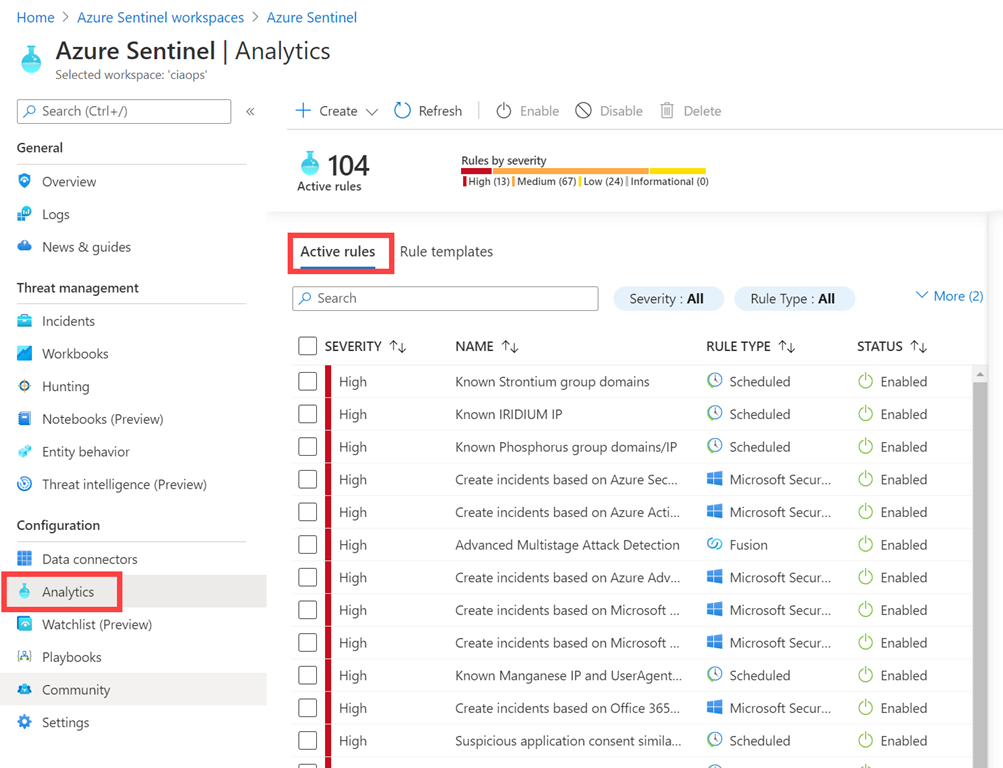
This corresponds with the Active rules area in the web portal as shown above.

The next section of the script output will show you all the available rules and whether they are in use or Active as shown above.
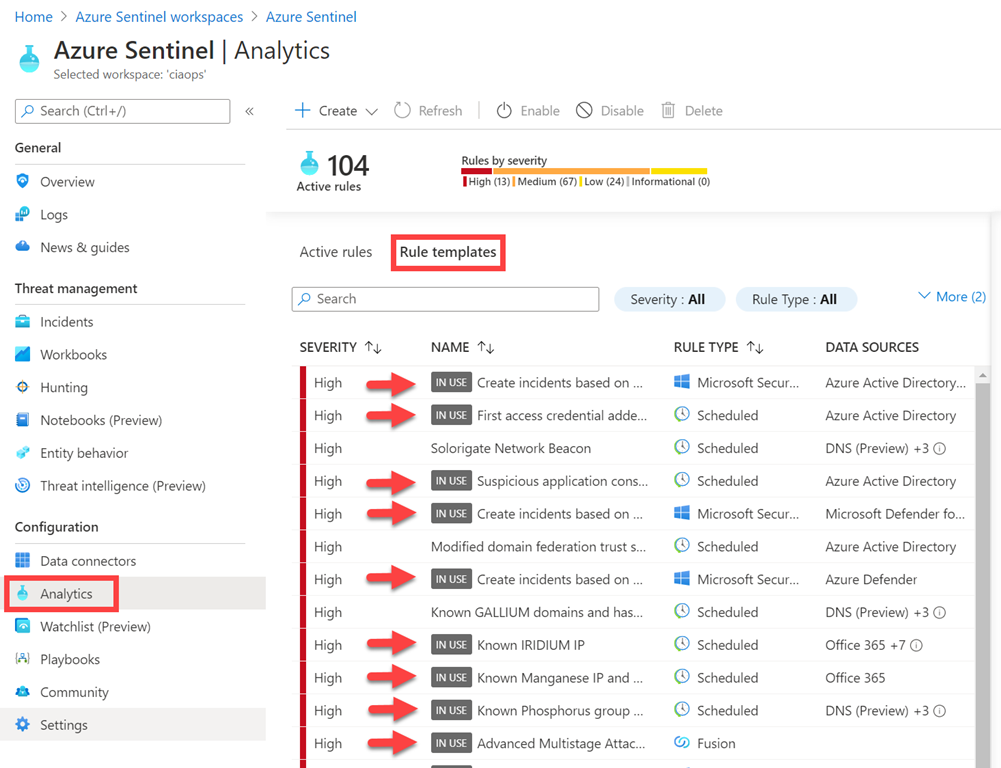
You’ll see something similar if you return to the Rule templates, and note the rules “IN USE”, as shown above.
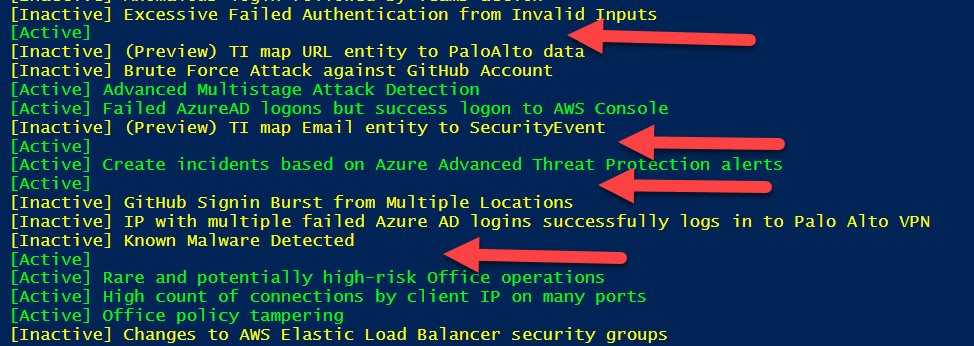
If you have a close look here, you’ll see rules that have no display name. I’ll cover that a bit further on, as it is still a bit of a mystery to me at this stage.
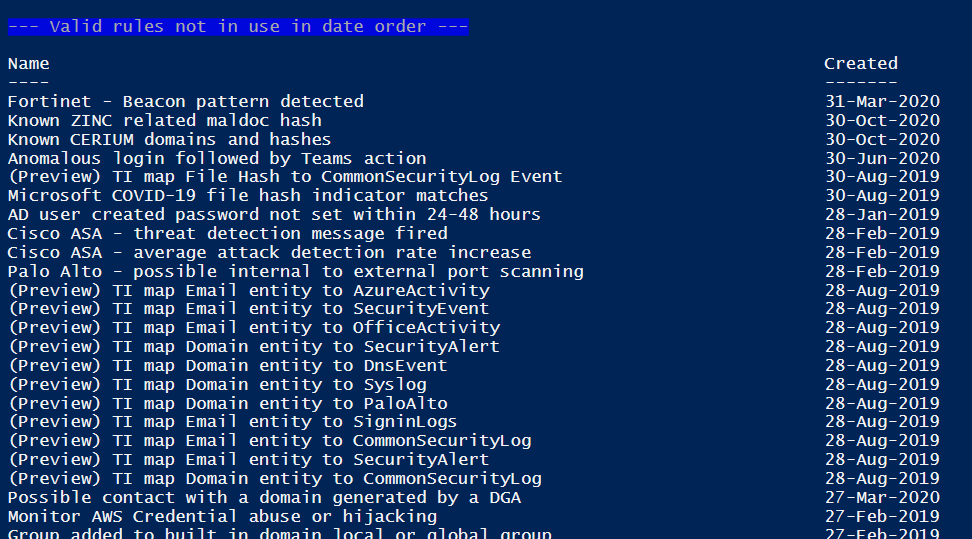
The last listing in script will show you all the rules that are NOT in use in date order. This is handy as I don’t see anything like this in the web portal.
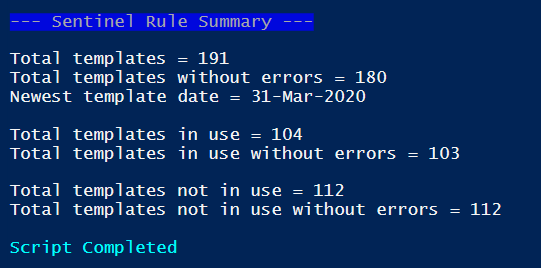
Finally, the script will give you a summary as shown above.
It is interesting to note that 11 scripts report errors? These seem to be the ones with no names? Still haven’t quite worked that one out yet. You might also see this mismatch in the rules in use as I have above. I need to dig into this a little more. Also a bit strange is the fact that I have 191 scripts reporting in total but if I add the 104 templates in use with the 112 not in use I come to a total of 216! If I then look in the web interface I see:
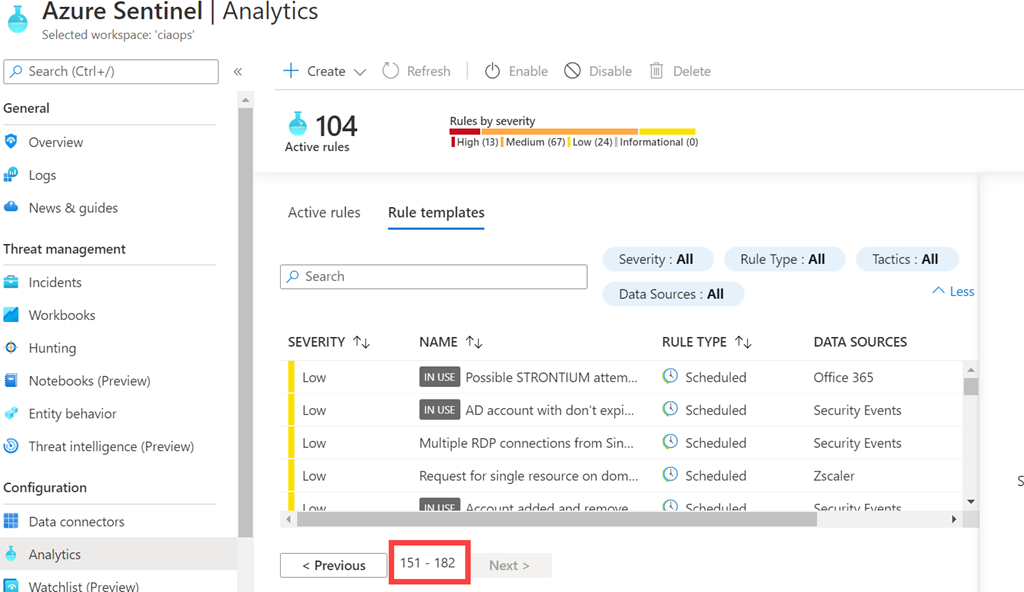
only 182 templates in total??
This new Azure Sentinel module is only a month old as of writing this article, so early days. Hopefully, these items are minor bugs that will get fixed soon. You can also double check my code to ensure I haven’t something silly. If I have, let me know so I can fix it and share.
However, that considered, I can see this new Azure Sentinel PowerShell module being pretty handy if I’m honest. This script allows me to see when Microsoft adds new rules that I need to go and configure for one. I’ll be spending more time with this PowerShell module to automate how I deploy Azure Sentinel, which I reckon will save me a bucket-load of time.
Looking forward to future updates to this module, but there is no reason you can’t start automating Azure Sentinel yourself today!

After installing the appropriate PowerShell modules you can connect to the Microsoft Graph with PowerShell using the command:
connect-graph
as shown above. First thing to remember is that this process can’t be completed in the Power ISE, you’ll need to do it elsewhere (here, using Windows terminal). The second thing to note is that you can specific the scope with which you to connect. Thus, in this case, the scope will be Files.ReadWrite.All and Sites.Readwrite.all. The scope is in effect the permissions the current user will be given when they connect to the Microsoft Graph. This allows you to only provide permissions for exactly what you need.

During the connection process you’ll be asked to consent to the permissions just requested, as shown above. If you simply select Accept here, you are just consenting for the current user. However, if you check the Consent in behalf of your organization option you’ll be providing these permissions to ALL users in your tenant! For now, only consent will be granted for the current user. However, be very, very careful consenting for the whole organization as I will illustrate.
You can now happily go off and perform whatever actions you need to using PowerShell for the Microsoft Graph.

With security in mind, I went to have a look at where these permissions just consented to actually appear. You’ll find them by opening the Azure Portal and navigating to Azure Active Directory as shown above. From here, select Enterprise applications from the menu on the left.

From the screen that appears ensure All applications is select from the menu on the left. Then on the right, locate and select Microsoft Graph PowerShell as shown.

From the screen that now appears, select Permissions from the menu on the left as shown. On the right you’ll then be able to select either Admin consent or User consent.
Because the permissions assigned were only for a single user, the User consent item will show these to us as shown above. This list of permissions matches those consented to when connecting to the Microsoft Graph.
The right hand most column in this display, Grant by, has a hyperlink to show the number of users with this assigned permission.

If you select any of these hyperlinks, you’ll see a list of users, on the right, that have been assigned this permission appear on the right as shown above.
Can you see the problem yet? No? Well…….how do you REMOVE or revoke a permission here?

From what I can determine, you can’t remove the permissions via the portal. If you select Review permissions menu option you’ll see a item displayed from the right as shown above. If you select the option This application has more permissions that I want and basically told to use PowerShell to revoke all permissions for this application as well as being provided with the code to do so.
The issue is that even after you disconnect from the Microsoft Graph, having completed any scripting, those consented permissions remain in place i.e. they are NOT rescinded. This means that if the user account with these permissions to the Graph is compromised then that attacker has access to the Microsoft Graph and potentially lots of sensitive areas in a tenant, especially if the permissions have been added to over time. Imagine how much WORSE it gets if permissions were consented tenant wide, rather than to an individual user?
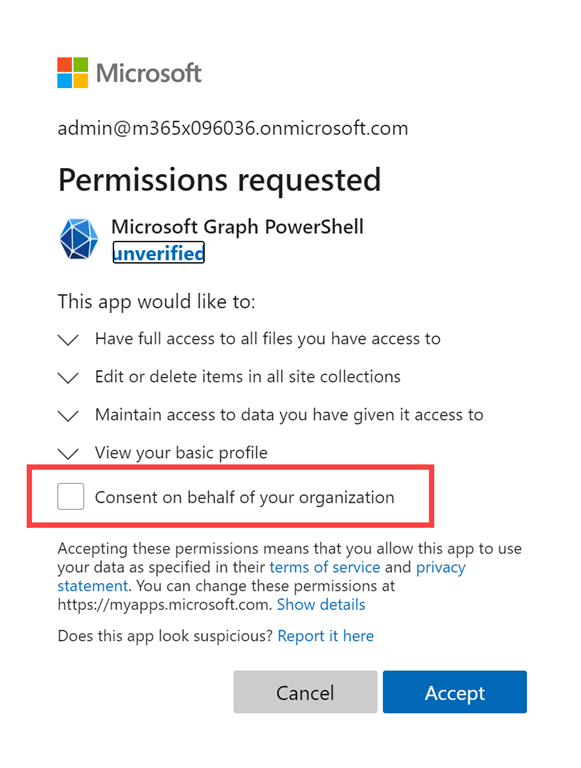
Selecting that little check box in the above Permissions requested dialog, which I see MANY people do without thinking, can really give you a security headache by opening up your Microsoft Graph permissions for EVERY user in the tenant!
Thus, best security practice is going to be to remove these permissions when they are no longer required as well as limiting who has them initially. Personally, I’d remove them after each interaction so I don’t forget and leave a potential attack vector.
To make doing all that a little easier, I have gone out and created a script that you’ll find in my Github repo:
https://github.com/directorcia/Office365/blob/master/graph-adappperm-del.ps1

If you run the script, it will first check whether the Azure AD PowerShell module is loaded. If it is, it will then ask you to login to your tenant. Then it will display a list of all the Azure AD applications in your tenant and allow you to select the ones you want to change (yes, you can select multiple Azure AD apps if you want) as shown above.
In this case, Microsoft Graph PowerShell application is selected.
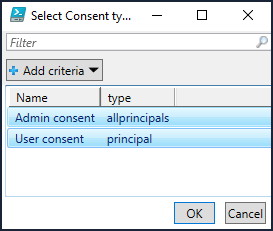
You’ll then be prompted to select whether you wish to select Admin consent and/or User Consent permissions. You can select both here if you wish by using the CTRL and/or SHIFT key when making selections (i.e. just like when you use Windows Explorer).

If you selected User consent, you’ll then be prompted to select the users you want. Again, multiple selections are available if offered.

You’ll now be prompted to confirm you wish to delete these permissions for these users.

Those permissions will be removed and the script will continue to work through the rest of your selections.
In this case, because there were no Admin consented permissions for this application we receive a notification line as shown in above output.

If you now return and have a look at the permissions for that app in the portal, you should see they have all been removed as shown above.
Leaving users with standing permissions to something as powerful as the Microsoft Graph is not best security practice. It is therefore important to regularly review these and remove what is not required. If you need those permissions again in eth future, after they have been removed, you can always re-consent to them when you next connect to the Microsoft Graph.
This is part of a series of articles about email security in Microsoft 365. Please check out previous articles here:
End to End email protection with Microsoft 365 – Part 1
End to End email protection with Microsoft 365 – Part 2
End to End email protection with Microsoft 365 – Part 3
End to End email protection with Microsoft 365 – Part 4
End to End email protection with Microsoft 365 – Part 5
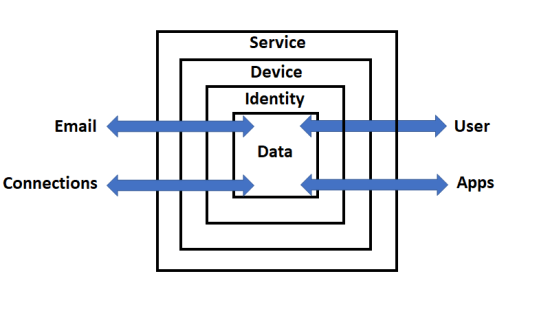
These articles are based on a model I have previously created, which you can read about here:
designed to help better explain expansive security included with Microsoft 365.
Email reporting and auditing
It’s now time to look at all the logging that occurs during even the simply process of receiving and viewing an email. For starters there is:
and
Message trace in the modern Exchange admin center
Message trace in the Security & Compliance Center follows email messages as they travel through your Exchange Online organization. You can determine if a message was received, rejected, deferred, or delivered by the service. It also shows what actions were taken on the message before it reached its final status.
There is also reporting options like:
Mail flow insights in the Security & Compliance Center
and
Mail flow reports in the Reports dashboard in Security & Compliance Center
as well as:
Microsoft 365 Reports in the admin center – Email activity
If you want to specifically look at email security there is:
Email security reports in the Security & Compliance Center
as well as:
Defender for Office 365 reports in the Reports dashboard in the Security & Compliance Center
and
Reports for data loss prevention (DLP)
I have also spoken about the importance of the Unified Audit Logs (UAL) in Microsoft 365:
Enable activity auditing in Office 365
Unified Audit Logs in Microsoft 365
and you need to ensure that these have been enabled so that you can:
Starting in January 2019, Microsoft is turning on mailbox audit logging by default for all organizations. This means that certain actions performed by mailbox owners, delegates, and admins are automatically logged, and the corresponding mailbox audit records will be available when you search for them in the mailbox audit log.
Here are some benefits of mailbox auditing on by default:
Auditing is automatically enabled when you create a new mailbox. You don’t need to manually enable it for new users.
You don’t need to manage the mailbox actions that are audited. A predefined set of mailbox actions are audited by default for each logon type (Admin, Delegate, and Owner).
When Microsoft releases a new mailbox action, the action might be automatically added to the list of mailbox actions that are audited by default (subject to the user having the appropriate license). This means you don’t need to monitor add new actions on mailboxes.
You have a consistent mailbox auditing policy across your organization (because you’re auditing the same actions for all mailboxes).
With this auditing enabled you can do things like:
and
Search the Office 365 activity log for failed logins
as well as
Audit Office 365 user logins via PowerShell
Many of the reports that you find in the Microsoft 365 Admin area can be scheduled to be sent via email per:
Apart from auditing and security you can also do more typical things like:
The availability of all this data is covered here:
Reporting and message trace data availability and latency
typically being 90 days.
User reporting and auditing
For information more specifically about user logins into the service and the Identity container, the best place to look is in Azure Active Directory (AD).
What are Azure Active Directory reports?
Find activity reports in the Azure portal
Azure Active Directory sign-in activity reports – preview
Audit activity reports in the Azure Active Directory portal
and if you want use PowerShell
Azure AD PowerShell cmdlets for reporting
Device reporting and auditing
There are lots of options when it comes to monitoring and reporting on devices. Apart from what is offered locally you also have:
Create diagnostic settings to send platform logs and metrics to different destinations
Manage devices with endpoint security in Microsoft Intune
You can even get telemetry data and analytics reports from your desktop applications via:
Windows Desktop Application Program
Aggregated data reporting and monitoring
As you can see with all the options above, it is easy to get to information overload trying to keep up with all those signals. Luckily Microsoft provides a range of services to aggregate all this for you to make monitoring and report easier.
The first is Microsoft Cloud App Security services:
Microsoft Cloud App Security overview
Microsoft Cloud App Security data security and privacy
There are plenty of reasons why you really should have Microsoft Cloud App Security in your environment:
A great security add on for Microsoft 365
Office 365 Cloud App Discovery
Next, is Microsoft Defender for Endpoint that will aggregate security and threat information for devices in your environment and make it available in a single console.
Overview of Microsoft Defender Security Center
Microsoft Defender Security Center portal overview
Microsoft Defender for Endpoint
Microsoft Defender for Endpoint evaluation lab
Finally for me, there is Azure Sentinel, which I see as really the ultimate hub for event reporting, monitoring and alrtign across the whole service.
Another great security add on for Microsoft 365
Introduction to Azure Sentinel
Azure Sentinel is a service that growing in features rapidly:
A couple of new additions to Azure Sentinel
Stay ahead of threats with new innovations from Azure Sentinel
Summary
Hopefully, all this gives you some insight into all the auditing and usage data that Microsoft 365 captures during any interaction within the service. One of the biggest benefits is also how this information is integrated between services, especially those that aggregate information lime Microsoft Cloud App Security and Azure Sentinel. This means you don’t have to crawl through individual log entries, you can use a dashboard and drill down from there. I also like the fact that all of these services and data are accessible using a scripting tool like PowerShell if you want to automate this further.
Remember, throughout this six part series I’ve just looked at what happens when a single email is delivered and view with Microsoft 365. If you expand that out to all the services and capabilities that Microsoft 365 provides you can hopefully get a better appreciate of the protection it provides in place for your data on many different levels.
The call to action for readers is to go away and implement all the security features that Microsoft 365 provides. This may of course vary by the license that you have. You should then consider what additional security offerings the Microsoft cloud stack can offer that makes sense for your business, then implement those. Remember, security is not a destination, it is journey.
This is part of a series of articles about email security in Microsoft 365. Please check out previous articles here:
End to End email protection with Microsoft 365 – Part 1
End to End email protection with Microsoft 365 – Part 2
These articles are based on a model I have previously created, which you can read about here:
designed to help better explain expansive security included with Microsoft 365.
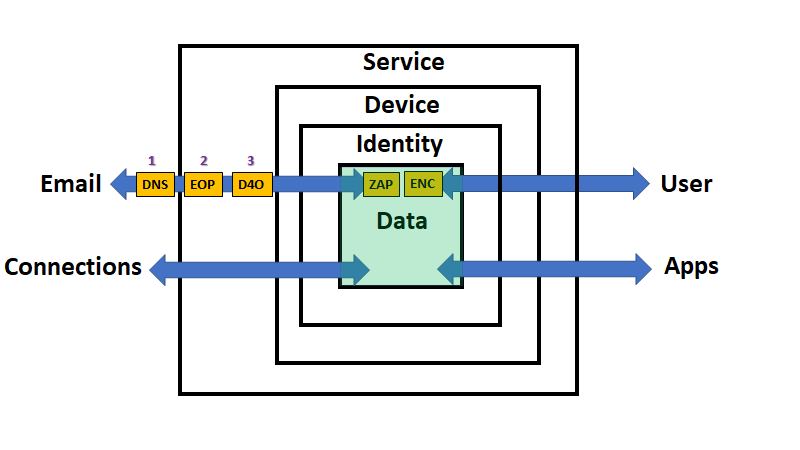
So far, email has travelled from ‘somewhere’ on the Internet (outside the service) through various layers of protection, which I have already spoken about previously. It has now finally come to ‘rest’ in the data container inside the Service (Microsoft 365) as shown above. However, even at ‘rest’, data is still protected thanks to the capabilities in Microsoft 365.
Remember, that as yet, there has been no user interaction with the data so far. The email has simply been delivered to the users inbox awaiting them to log in and view it.
While the email sits inside the data container in Microsoft 365, protection is being provided by Zero Hour Purge (ZAP). As Microsoft says:
In Microsoft 365 organizations with mailboxes in Exchange Online, zero-hour auto purge (ZAP) is an email protection feature that retroactively detects and neutralizes malicious phishing, spam, or malware messages that have already been delivered to Exchange Online mailboxes.
which you can read more on here:
Zero-hour auto purge (ZAP) in Exchange Online
This means that even after an email is delivered to a users inbox it is constantly being monitored as to whether it is phishing, malware, spam or something otherwise nefarious. If it is detected as such, then appropriate action is taken. Such action can be determined by an administrator during configuration things like spam policies per:
Use the Security & Compliance Center to create anti-spam policies
So this means that not only does Microsoft 365 scan inbound and outbound emails as they pass through the service, they continue to scan all emails once delivered thanks to the fact that they reside inside the actual Microsoft 365 service at all times. This is a big benefit over third party scanning services that only do so as the email passes through their filters, no inside the actual inbox.
You can therefore rest assured that if a malicious email is detected at any stage in Microsoft 365, and assuming you have enabled ZAP, you’ll be protected.
While sitting on servers in Microsoft data centers all sorts of additional protections are in place such as being encrypted at rest:
Encryption in the Microsoft cloud
Encryption Risks and Protections
In addition to using volume-level encryption, Exchange Online, Skype for Business, SharePoint Online, and OneDrive for Business also use Service Encryption to encrypt customer data per:
The best reference for all the extensive Microsoft cloud protections is the:
You also might want to take a look at virtual tour of a Microsoft datacenter:
Take a guided tour of a Microsoft datacenter to learn how Microsoft delivers your cloud services
and read about how Microsoft meshes all these datacenters together to provide the Microsoft 365 service:
Azure facilities, premises, and physical security
Hopefully now you are comfortable with the fact that the protection Microsoft 365 provides for your inbound email data (as well as all your other data) is rigorous, from the moment that it enters the Microsoft 365 service until it sits ready for a user to interact with it.
The next stage in the journey will be for a device (i.e. PC) to connect to the Microsoft 365 service and then for a user to log into that device and run an app, like Outlook, to read the delivered email. Spoiler alert – there is even more protection involved here and I’ll start covering that in upcoming articles, so stay tuned for a closer look at what happens during user interaction with the data inside Microsoft 365.
Security is big this week and you’ll get it all here. Our cloud news will provide you with all the latest information you’ll need to understand the Solar Winds attack. in this episode we also speak with Daniel Chronlund around Conditional Access. Daniel shares his extensive knowledge around this service and how it can improve your security posture. He also has some great scripts available on his Github repository, so check them out!
I take this opportunity to wish listeners happy holidays. Stay safe and thanks for all your support in 2020. Onwards to 2021 we go, hi ho, hi ho.
This episode was recorded using Microsoft Teams and produced with Camtasia 2020.
Take a listen and let us know what you think – feedback@needtoknow.cloud
You can listen directly to this episode at:
https://ciaops.podbean.com/e/episode-262-daniel-chronlund/
Subscribe via iTunes at:
https://itunes.apple.com/au/podcast/ciaops-need-to-know-podcasts/id406891445?mt=2
The podcast is also available on Stitcher at:
http://www.stitcher.com/podcast/ciaops/need-to-know-podcast?refid=stpr
Don’t forget to give the show a rating as well as send us any feedback or suggestions you may have for the show.
Resources
A moment of reckoning: the need for a strong and global cybersecurity response
SolarWinds Post-Compromise Hunting with Azure Sentinel
Ensuring customers are protected from Solorigate
Microsoft Defender for Office 365 investigation improvements coming soon
4 ways Microsoft 365 is improving the experience for Mac users
Sleeping Tabs in Microsoft Edge: Delivering better browser performance
Guest Access in Yammer using Azure AD B2B is now in preview!
Stay current with in-demand skills through free certification renewals
Microsoft Clarity | Free behavioral analytics product for website managers

When you are looking at various entries in the Azure AD logs you will find, under the Basic Info tab, a Sign-in error code and directly below that a Failure reason field as shown above.

The above, shows you these fields in more detail.
You may not be aware but if you navigate to the web site:
https://login.microsoftonline.com/error

and plug in the Sign-in error code from the event, you should see information like that shown above. Most of it should match what the Failure reason field says. There can however, also be additional information in there that may help you when it comes to troubleshooting these events.